2020 Presidential Election Analysis
Feven Yohannes, Harvard University
Economy: How does the Economy Affect Presidential Elections?
September 18th 2020
Presidential Elections and the Economy
Every presidential election covers one aspect, in particular, the economy. But what does the economy entail? Is it the stock market? Inflation rates? GDP growth? Many scholars have investigated this topic, specifically exploring the effect that Quarter 2 GDP growth can have on presidential elections. Scholars have generally found that this variable can be a significant predictor variable for the outcome for the election because voters generally give more weight to recent experience (Achen and Bartels). Given that scholars have found a strong correlation between Quarter 2 GDP growth and election outcome, it would be interesting to compare the difference in effect that this has on the incumbent party versus a non-incumbent party.
Quarter 2 GDP Growth
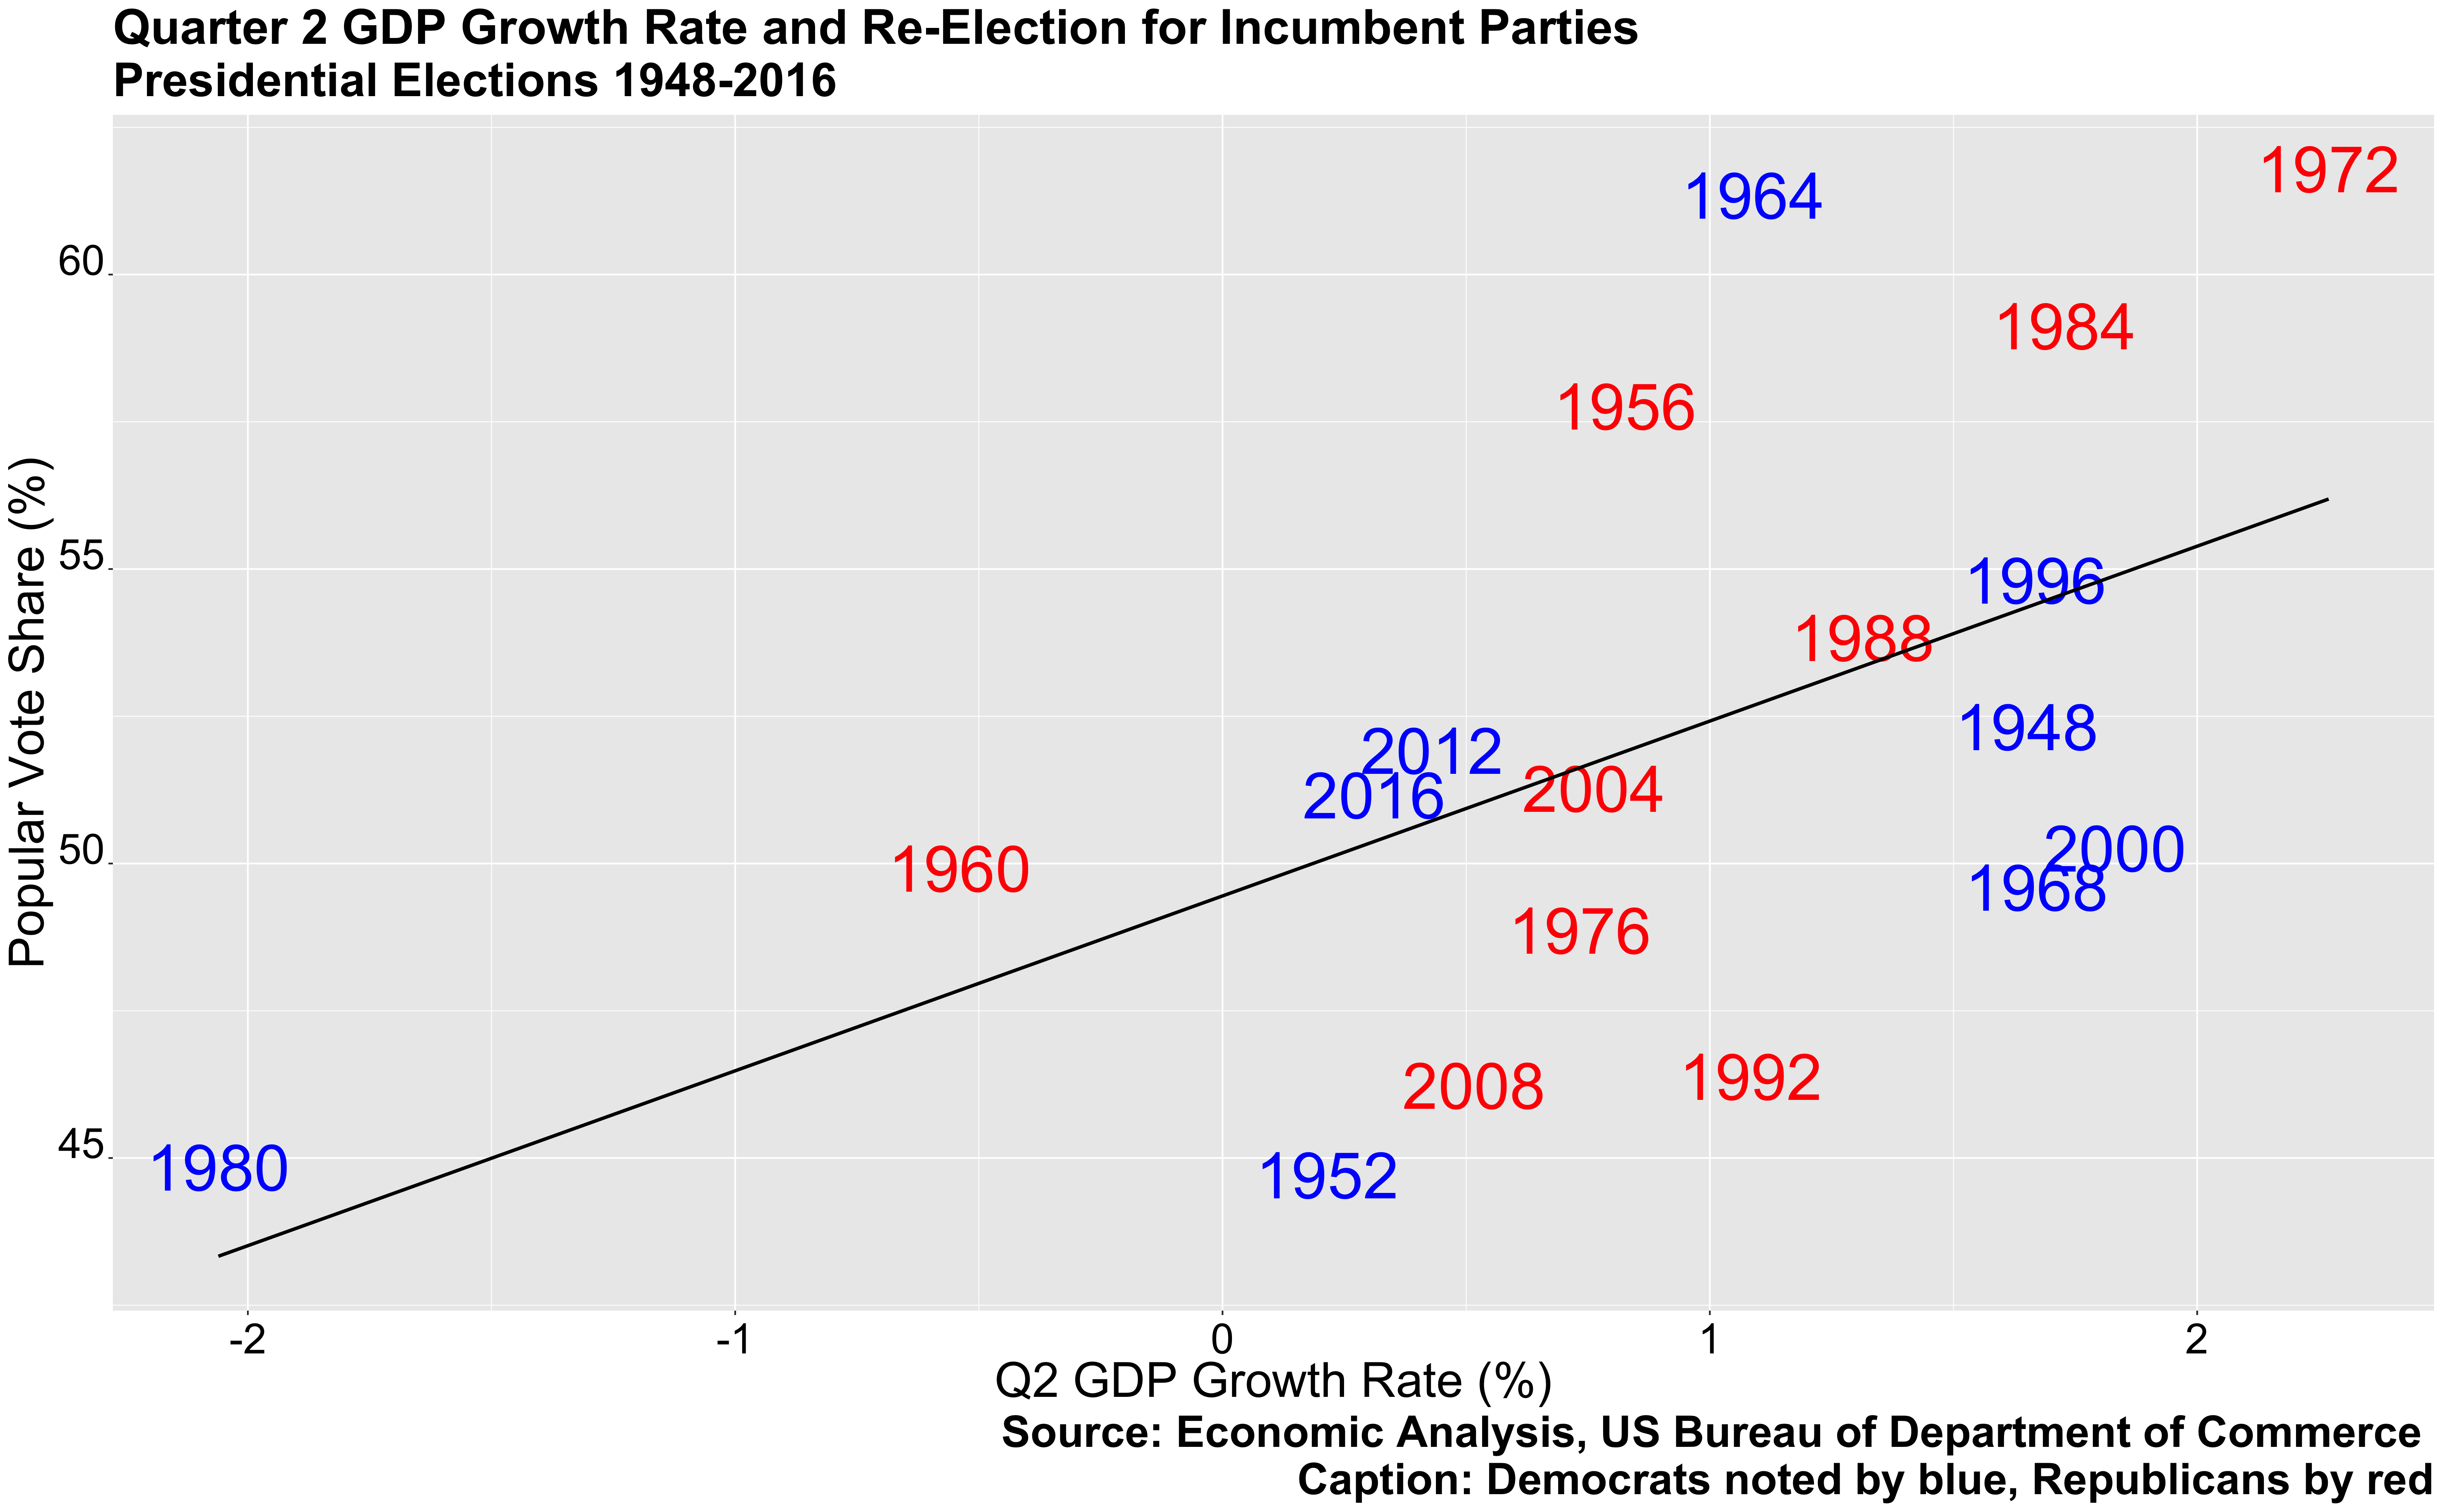
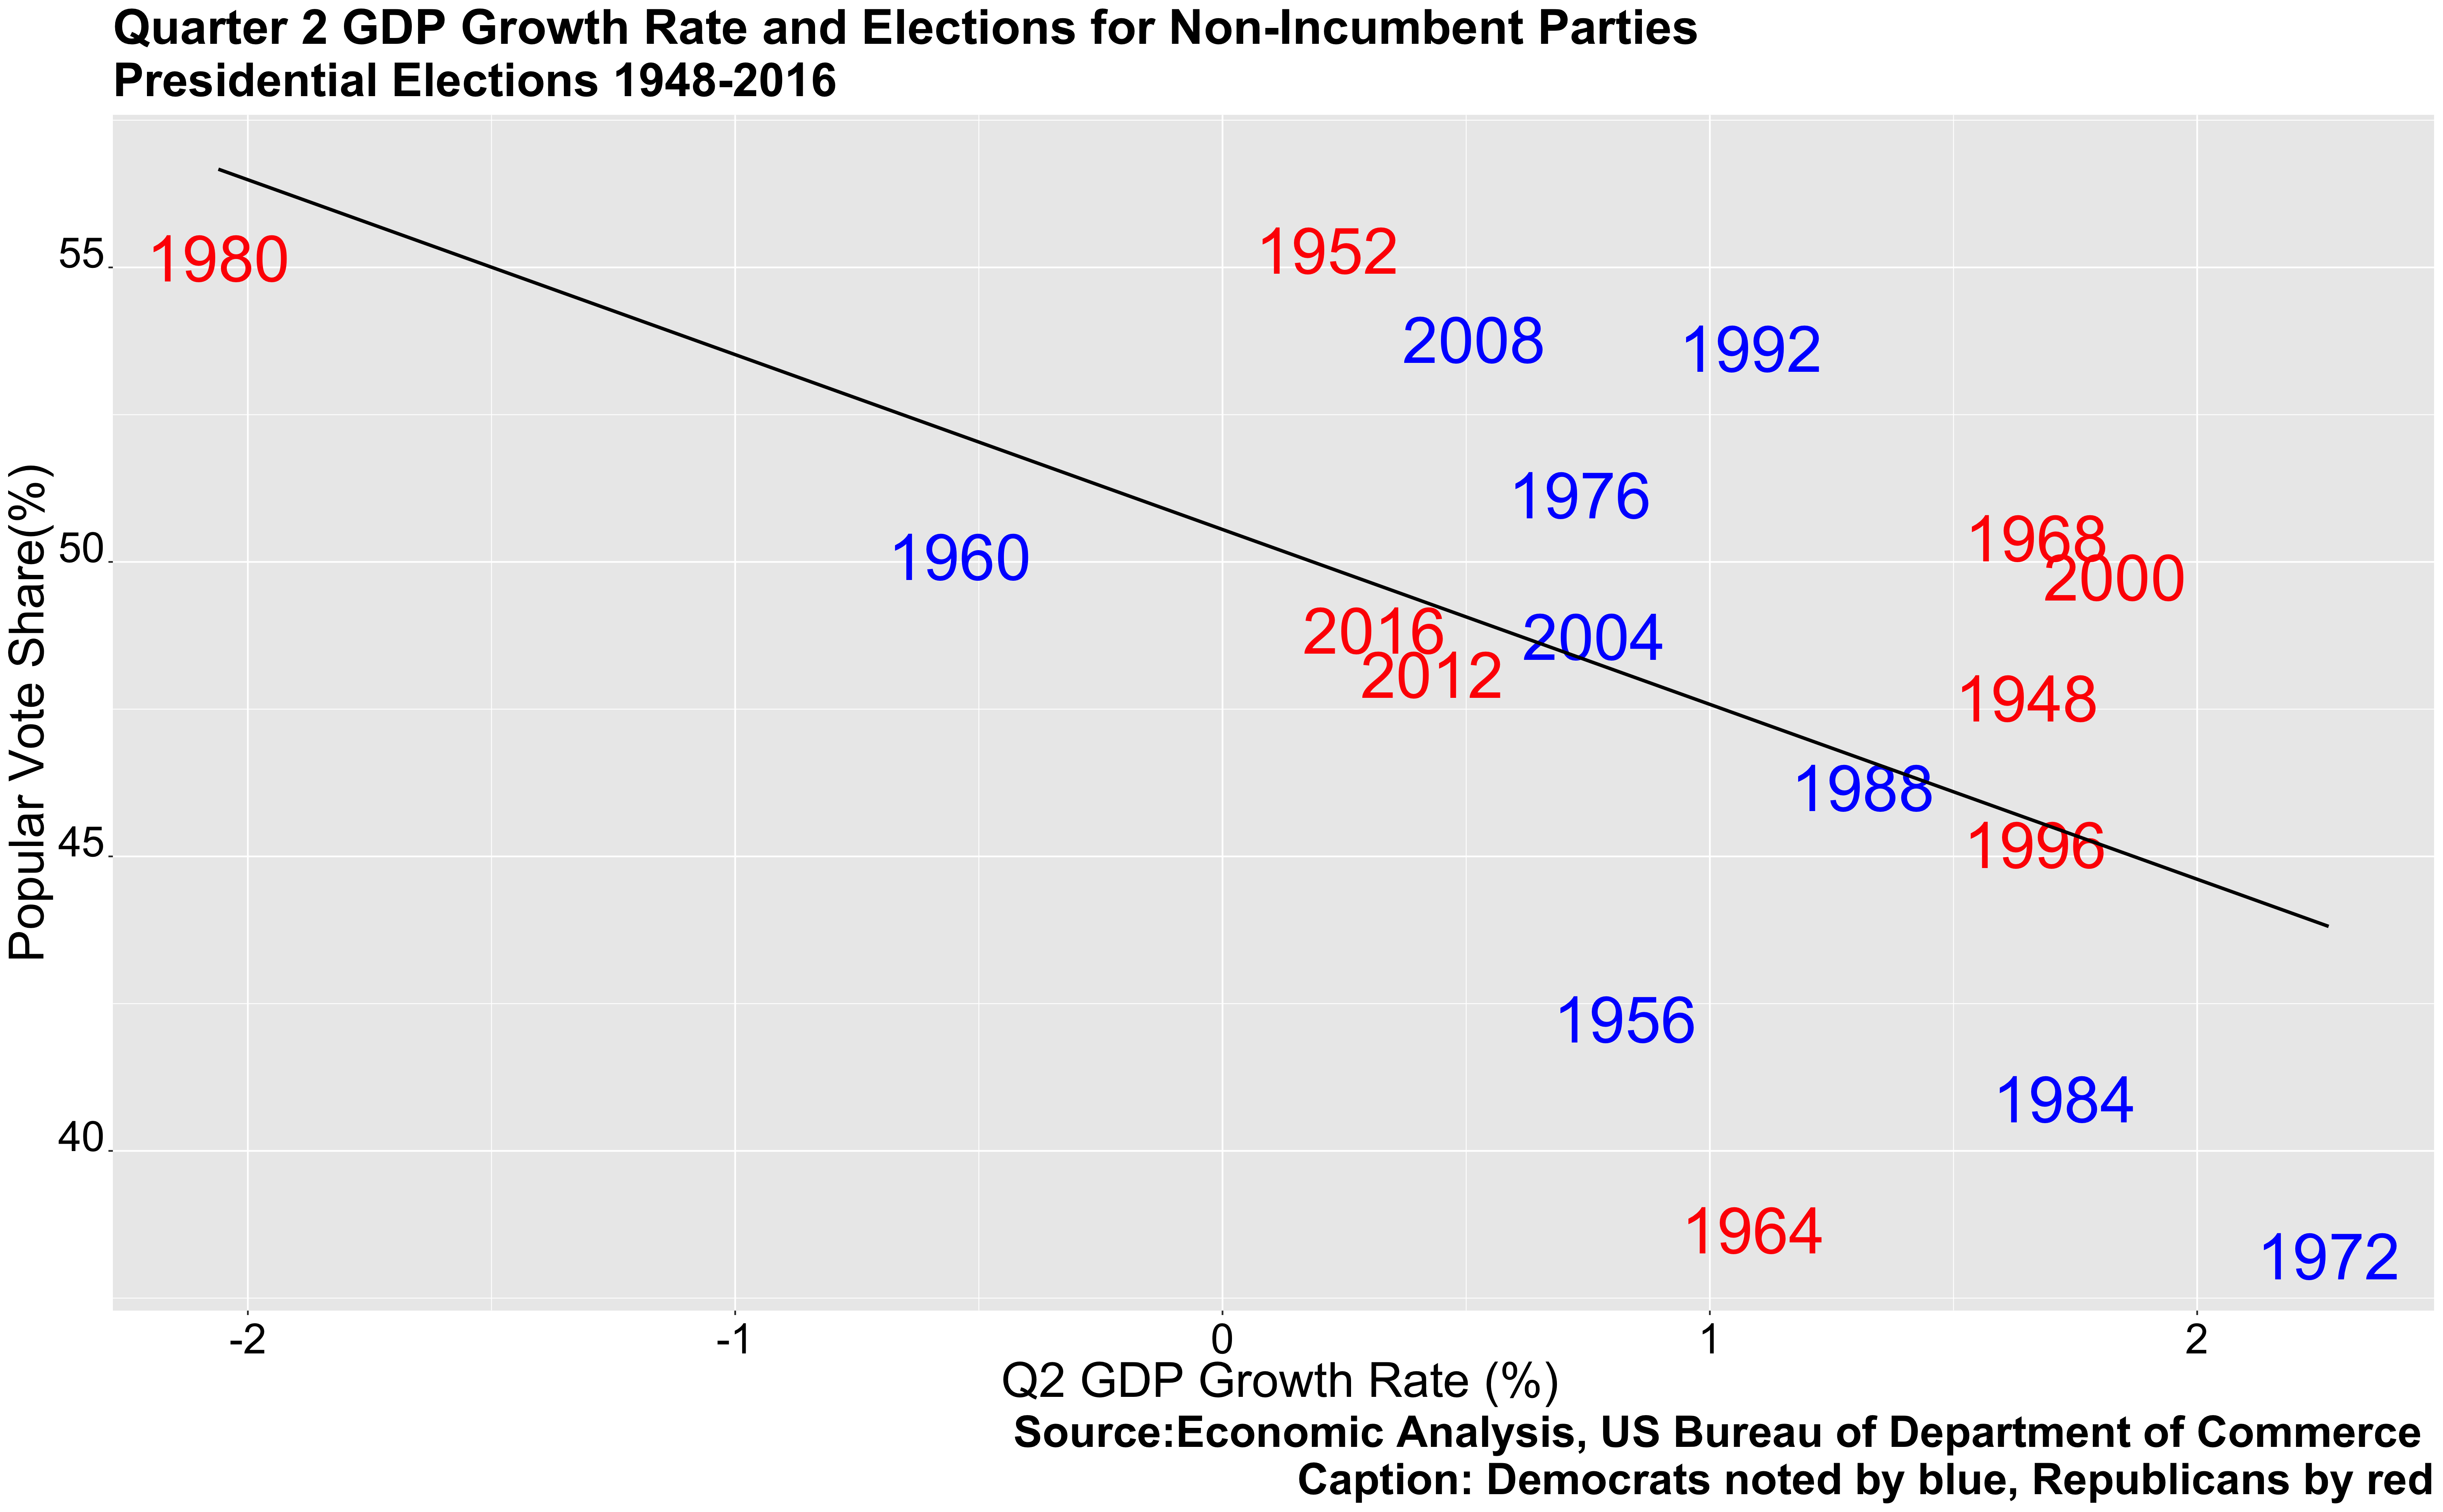
The graphs above show that historically there has been a positive correlation with Q2 GDP growth and re-election for the incumbent party and a negative correlation for the non-incumbent party. Thus, for incumbent parties, it seems like candidates tend to win larger vote shares when there’s increased GDP growth in Q2. On the other hand, for non-incumbent parties, the opposite occurs, there’s a negative correlation, and thus, declines in GDP growth rate seem to correlate with larger popular vote shares. The reason for the difference between the two graphs is rooted in how voters perceive blame and success for the state of the economy. If the economy is doing well while an incumbent party is running for president, voters may credit this to the incumbent party and reward them by re-electing the party. However, if the economy isn’t doing as well (Q2 GDP growth decreases), voters may blame the incumbent party and punish them by electing the other party.
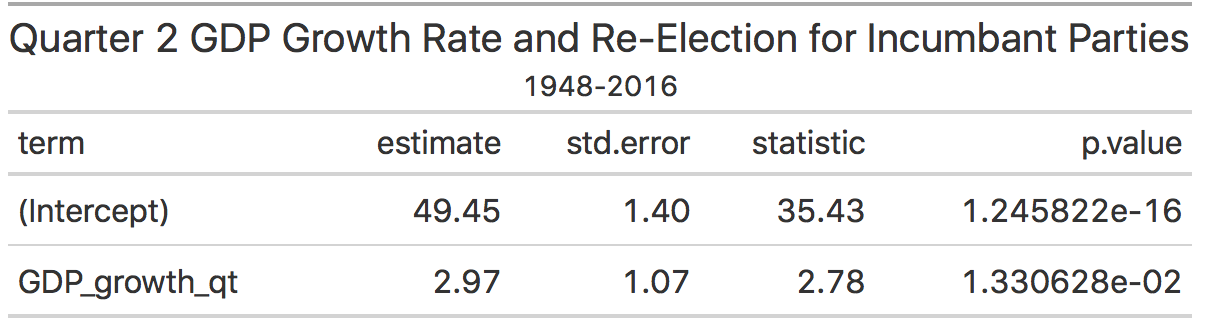
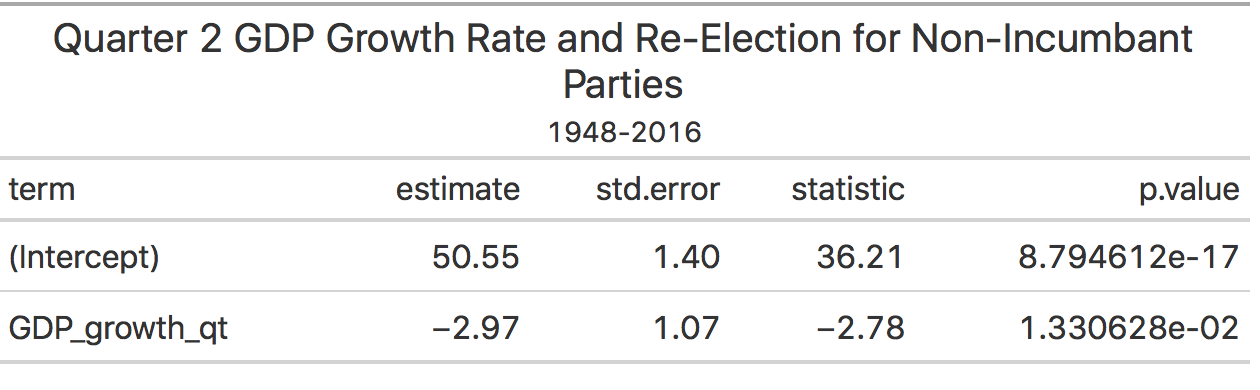
To investigate this further, one can compare the regression summaries of these two graphs. The first table shows us that if GDP in Q2 were to remain the same, then the candidate from the incumbent party would receive around 49.5 percent of the votes. The GDP_growth_qt coefficient reflects that with each percentage of GDP growth, the candidate would expect an increase in vote shares by almost 3 percent. Similarly, the second table shows us that with no change in GDP in Quarter 2, then the candidate from the new party would receive around 50.5 percent of the vote share. The GDP_growth_qt coefficient demonstrates that with each percentage decline in GDP growth, the candidate would expect a decrease of almost 3 percent for vote shares.
Predictions for Trump with Q2 GDP Growth Rates
Using the information from the regression above, one can predict the outcome of the popular vote for Trump. If we input the 2020 Q2 GDP growth rate of -9.49 percent, our model predicts that Trump will win 21.26 percent of the vote share. This number is quite low and reflects the economic downturn caused by the pandemic. Thus, we can expect that this value understates what the real vote shares will turn out to be. Part of this is because some voters may perceive the handling of the pandemic as independent of Trump’s performance. Voters may think that the economic decline was inevitable because of the current crisis and may believe that it is by chance that the recession occurred during a Trump presidency. If that is the case, it would also be helpful to compare the GDP growth rate of 2019 Q4 (the quarter right before the pandemic began). If we input this growth rate of 0.58 percent, our model predicts that Trump will win the popular vote with 51.2 percent of the votes. This goes to show that modeling with just this one variable contains a lot of uncertainty due to the unprecedented economic and health conditions.
Unemployment and Incumbent Elections
Another interesting economic variable to consider is unemployment rates. This variable, at times, can give us insight into the well being of the economy. But can it help us predict the outcome of the election?
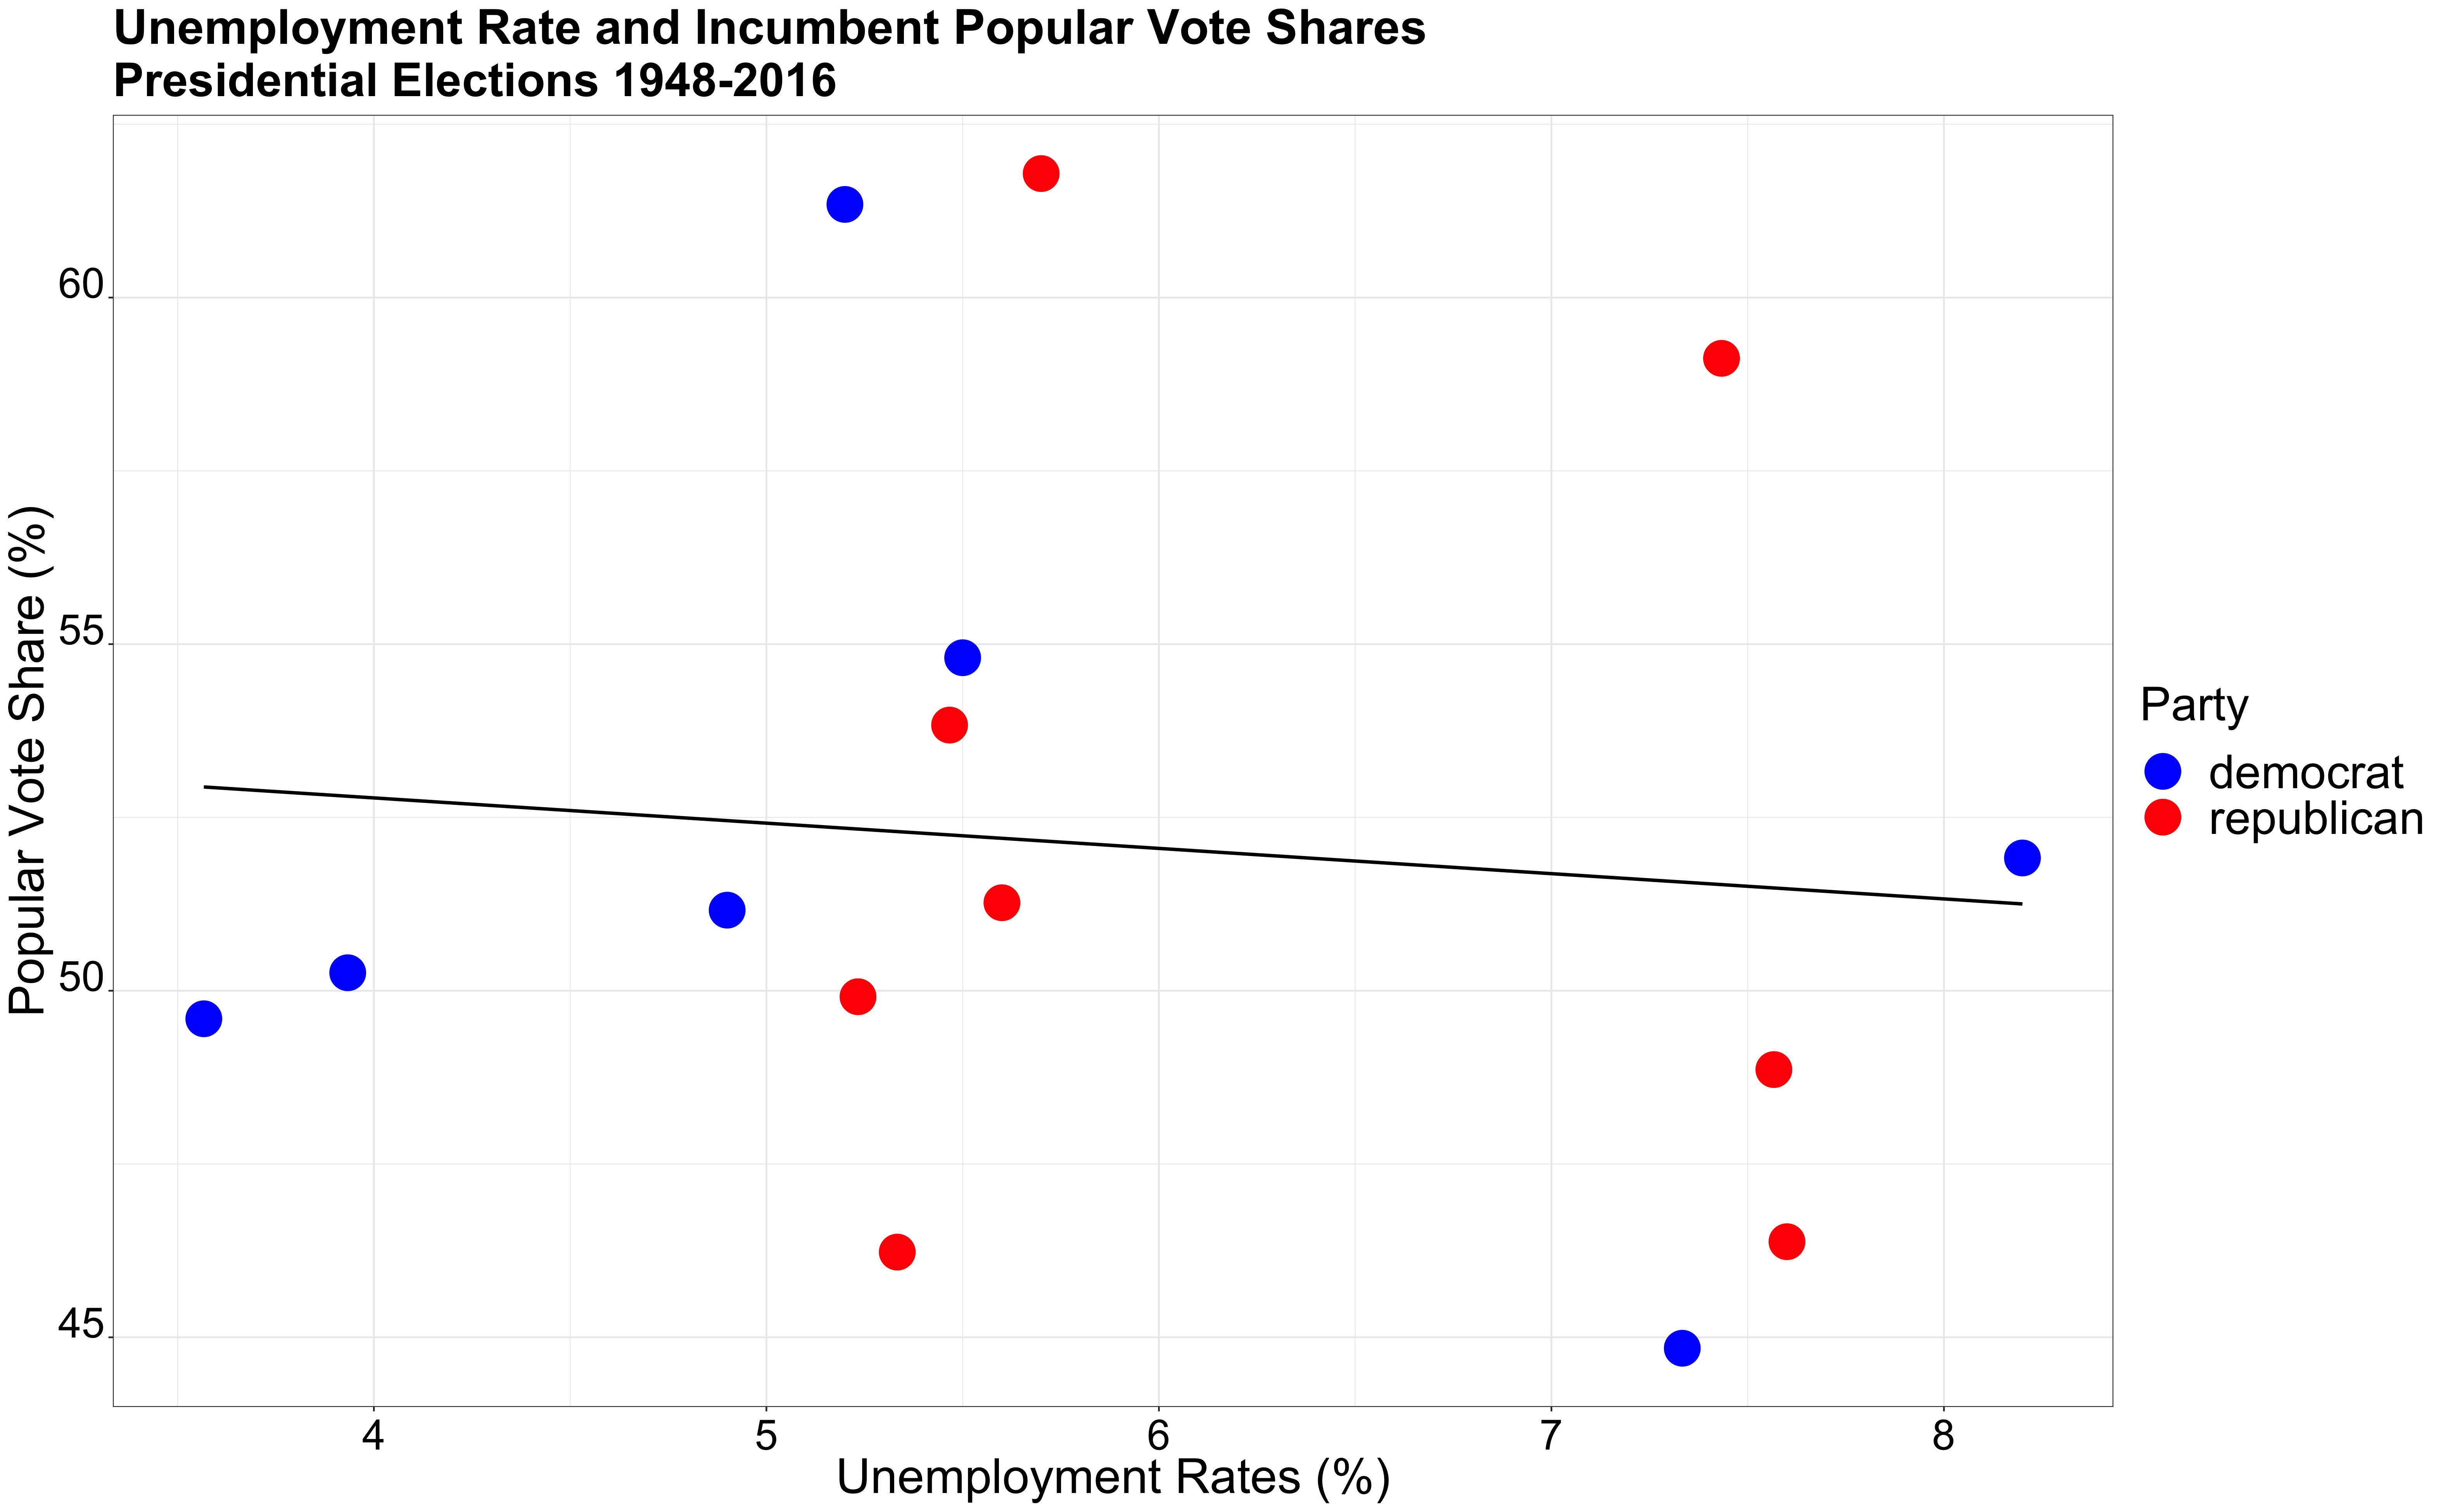
When conducting a regression on unemployment rates and the incumbent popular vote, one finds that the intercept of this line is 54.23 and the unemployment coefficient is -0.36. It shows that an incumbent will receive around 54 percent of the vote share when there’s no unemployment, and will lose 0.36 percentage points for each percentage increase in unemployment. Thus, it seems like unemployment rates have a relatively small effect on vote shares. This is also highlighted in the R squared value, which is around -.06, thus showing relatively little correlation as the R squared is quite far from -1 and 1 (values that show perfect correlation).
Predictions for Trump with Q2 GDP Unemployment Rates
Thus, when imputing our quarterly data into the model, the model predicts that with an unemployment rate of 13.3 percent, Trump would win 49.49 percent of the popular vote. When using 2019 Q1 data of an unemployment rate of 3.88 percent, the model predicts that Trump would win 52 percent of the vote share. Even with a change in unemployment of almost 10 percent, Trump’s vote share margins only change by 3 percent, thus emphasizing that unemployment rates on their own might not be the best predictor for this election.
Conclusion
Both GDP growth rates and unemployment rates reflect valuable aspects of the economy; however, they may not be the best predictor variables on their own. In Q2, GDP growth rates declined immensely and unemployment rapidly increased due to the pandemic. In our models, both of these variables predict a Trump loss in the popular vote, with our first model understating Trump’s vote share and the second model providing us with a much closer election outcome. In conclusion, while both of these variables are helpful in out analysis, given the pandemic and the uncertainty that it has caused, I also recognize that one must include other variables in our prediction model to give us a better picture.